
This week, I’m taking a class on Intermediate Statistics as part of my Technical Marketing module on CXL and it has been fascinating. As one who studied English and probably avoided statistical abstractions for most of her life so far, the fact that I’m enjoying this class makes me wonder about a lot of presumptions I’ve had.
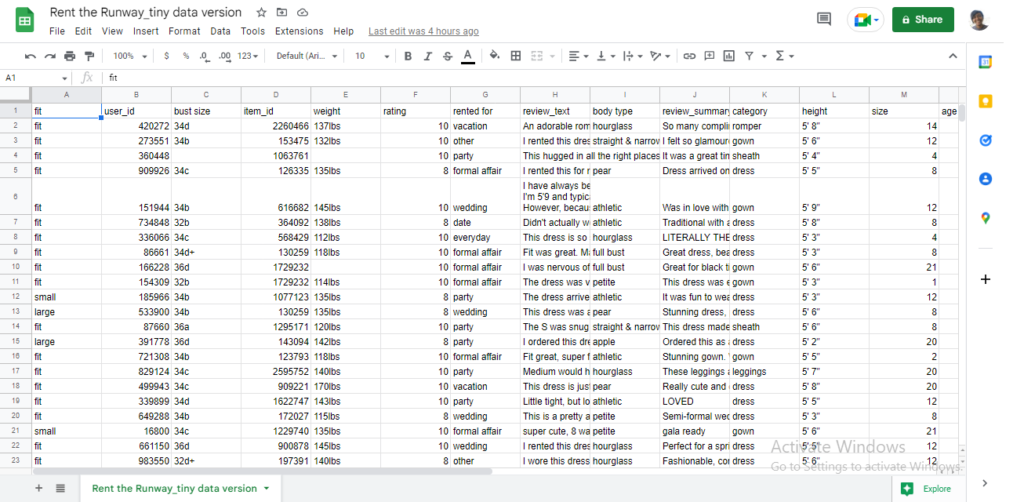
To practice what I’ve been learning, I’ve looked for a public dataset my marketing mind wants to dig into – in this case, Rent the Runway clothing fit feedback, and here I try to sink my teeth into it.
Rent the Runway is an e-commerce platform that allows users to rent, subscribe, or buy designer apparel and accessories.
In this exercise, I’ll be practising my intermediate statistics lesson from CXL’s Technical Marketing course to:
- understand how satisfied customers were with their cloth fitting.
- analyse the areas to focus on.
- check if there’s a relationship between two variables in the dataset
Based on the public dataset used by (Rishabh et al., 2018), I’ll be using contain measurements of clothing fit from Rent the Runway, gotten via a short survey targeting purchasing customers.
Containing the following metadata:
ratings and reviews
fit feedback (small/fit/large etc.)
user/item measurements
category information
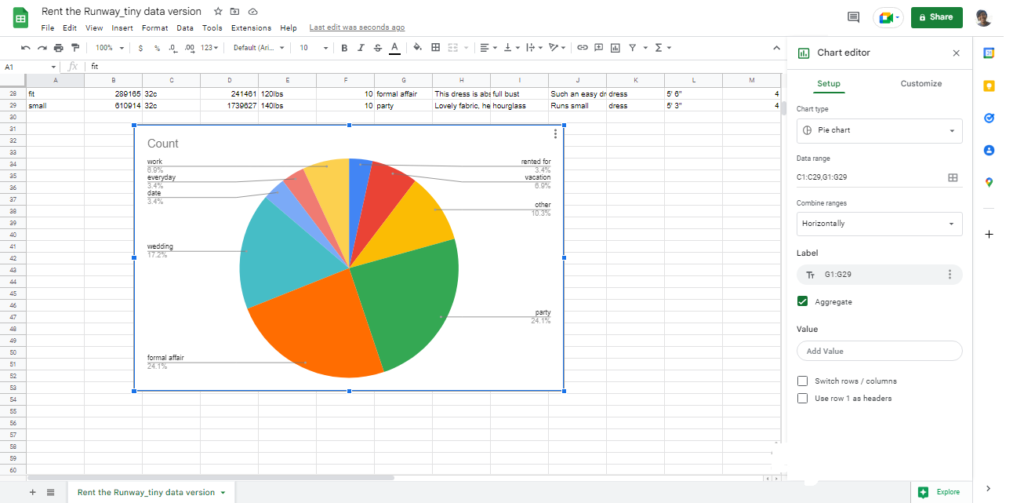
What occasion/event do people rent the most for?
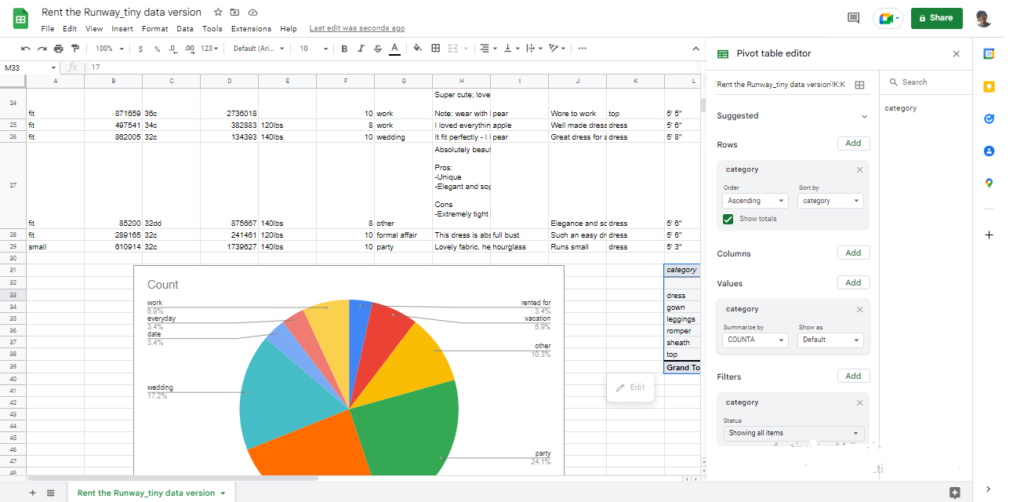
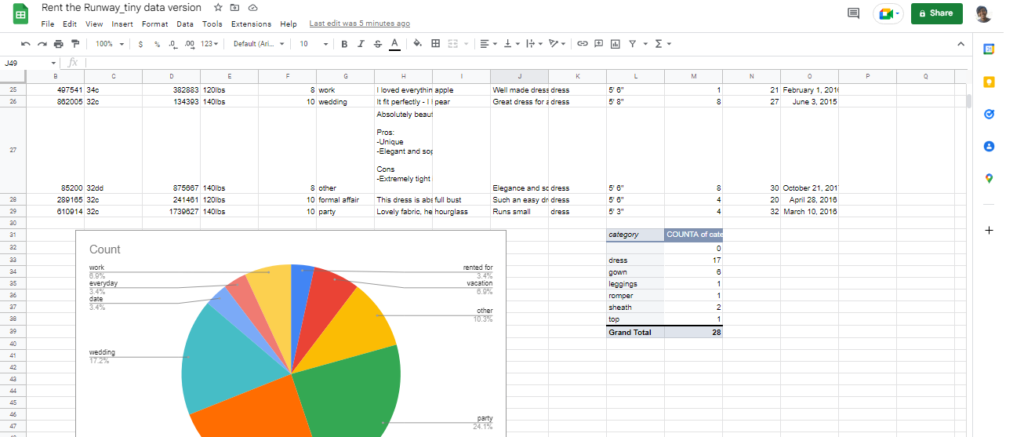
What category of clothing do people rent the most?
Identifying correlated variables
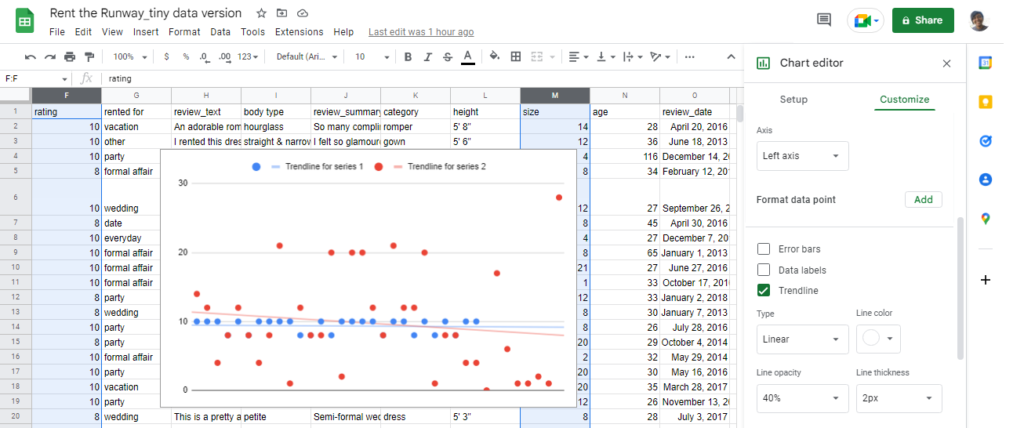
Here we want to gauge the extent of the relationship, or dependence, of two variables.
In this case, we investigate if there is a correlation between customer clothing size and the ratings they give. Using the CORREL function in Google sheets (which takes two input ranges for the two data sets to find the correlation), we check if there’s a link between customer size and ratings.
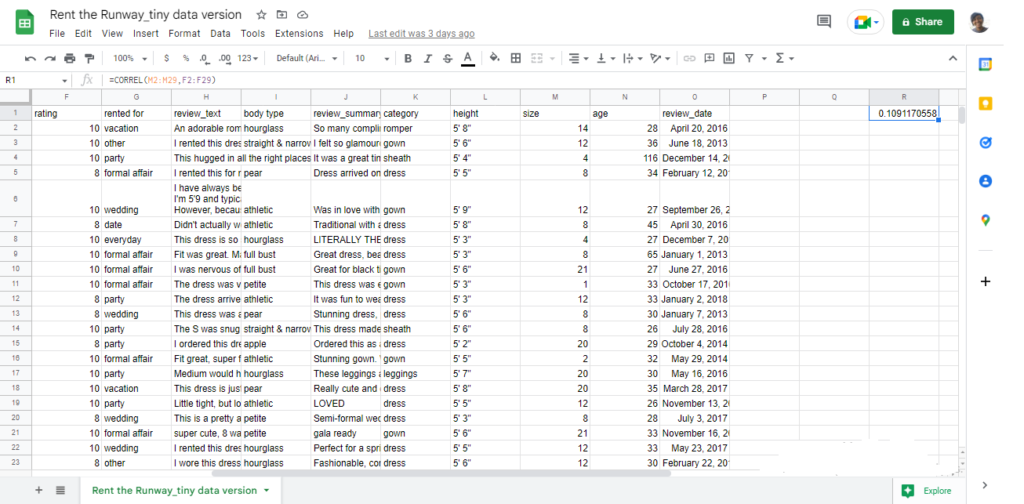
Note: Correlation does not necessarily imply causation. Just because two variables are behaving in the same way. It does not mean one caused the other to occur.
In some form of conclusion, understanding statistics is helping me see how to utilise customer data, in predicting and modelling behaviour that works for marketing.
Resources:
Decomposing fit semantics for product size recommendation in metric spaces
Rishabh Misra, Mengting Wan, Julian McAuley
RecSys, 2018.